Using the GUI
If you compile mantaflow with the GUI option, and display it using gui.show() in the scene definition file, you can preview the simulation in the integrated GUI.
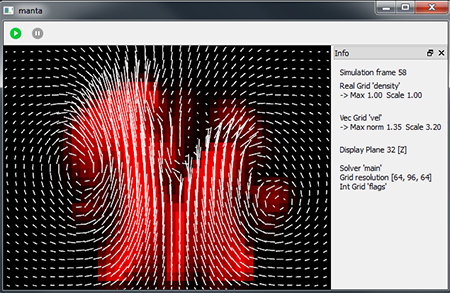
The main screen on the left shows the simulation domain with a display plane to inspect a 2D slice of the volumetric grids - in the picture above, the smoke density is shown in red and the velocity vector field is displayed as white arrows. The info panel on the right displays the grids selected, simulation dimension, and other user data. It is also possible to add simulation-specific controls and labels in the scene definition file.
Navigation
Here is a summary of the most important keyboard shortcuts. Click the '?' button in the UI for a keyboard map.
| Left MB | Rotate view |
| Right MB | Pan camera |
| Wheel | Zoom |
| W/A/S/D/Q/E | Move camera |
| X | Next integer grid |
| C | Next scalar grid |
| Shift + C | Toggle scalar grid display modes |
| V | Next vector3 grid |
| Shift + V | Toggle vector display mode, e.g. centered/MAC vectors |
| B | Next particle system or particle data field |
| Shift + B | Toggle particle display |
| M | Next mesh |
| Shift + M | Toggle mesh display mode |
| ',' and '.' | Scale scalar grid values |
| ';' and ''' | Scale vector grid values |
| Brackets | Scale mesh values |
| '9' and '0' | Scale particle data values |
| Plus / Minus | Move display slice |
| '8' / Multiply | Toggle display slice x/y/z |
| G | Toggle all grid displays |
Simulation control
These hotkeys control simulation flow
| P | Pause / Resume simulation |
| L | Step through simulation |
| Space | Update grid data while simulating |
| Escape | Abort the simulation and quit |